
PROJECT METHODS
INTRODUCTION
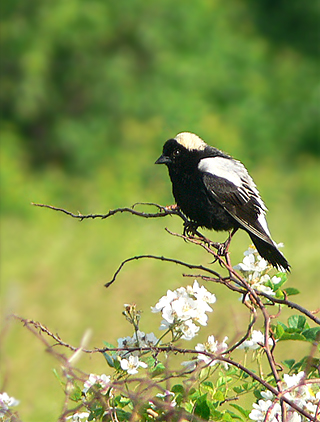
The BCN Survey, which began in 1997, is a breeding season monitoring program implemented in the Chicago Wilderness region by the Bird Conservation Network. Volunteers are recruited and trained in conjunction with land management agencies throughout the region. Approximately 200 experienced volunteer monitors now collect data through methods developed in 1997 by a team of Chicago Wilderness land managers, birders and ornithologists. The methods are point count, transect and checklist. Data is entered online using eBird. The database is shared with land managers and researchers annually.
In the past, a lack of standardized protocols and the need to digitize extensive field data meant that much birders’ information remained largely inaccessible or at best difficult to use for region-wide studies. The standardized protocol of the BCN Survey transformed avian monitoring practices in the Chicago area. As this was one of the first projects to extensively collect birders’ sightings online, we hope that the analysis of the data twenty-one years into the project will be of help to the many others around the country who are organizing similar projects.
The primary purpose for the collection of these data is to provide land managers with information that can help guide restoration practices. Its creators envisioned a second purpose: when the database grew large enough, it might be used to describe local population trends for species of concern. After amassing over 100,000 records and eight years of data, in 2004 BCN and Audubon-Chicago Region set out to investigate species trends in the region. This initial phase showed that the database is large enough to yield useful data for many species, and that it is possible to apply analysis methods that will yield credible trends.
In 2007, after amassing over 180,000 records, a more intensive analysis attempted to refine previous results and ask new questions. In 2013, after another five years had passed, a third analysis was initiated to update the trends and in an effort to continue to improve the accuracy and significance of the results. And again, in 2021, a fourth trend analysis was completed for the years 1999 – 2020. The results from this latest analysis are displayed here on the website.
POINT COUNT PROTOCOL
The BCN Survey has three protocols that are used by our monitors, but only the point count data were selected for this analysis. Point counts are conducted during the breeding season. Monitors are asked to conduct a minimum of two visits during June. They are instructed to start close to sunrise (between 5:15 a.m. and 5:20 a.m.), and complete counts by no later than 9:00 a.m. Points are located at least 150 meters apart. Point counts are five minutes in length and all birds seen or heard within a 75 meter radius of the point are recorded. Birds detected outside the radius are noted separately. It is requested that monitors walk the route in a different order on different days in order to maximize the number of birds detected during the hours when birds are most active.
After monitoring has been completed, data is entered on the BCN eBird website.
For more details regarding our survey methods, please visit the BCN Survey protocol page.
POINT SELECTION METHODS
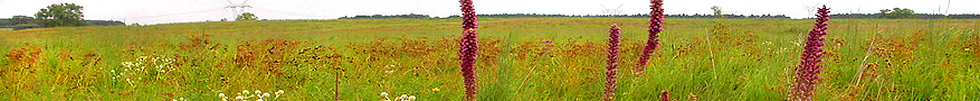
The BCN Survey is designed to cover preserved land in the Chicago Wilderness region. Preserves were chosen based on preferences of available citizen science monitors, and thorough coverage of the preserve or a section of the preserve was attempted through point placement. Points were selected in conjunction with land managers and were selected in a variety of ways. Some were placed at intervals designed to get the best views or coverage of the habitat being surveyed. Others were randomly placed throughout the site, often using a grid method. Others were placed along walkable trails at intervals of 150 feet. In recent years, points have also been randomly assigned in habitat units. Points are almost exclusively located in natural areas that are usually owned by one of the county forest preserve districts, the state, or local municipalities. The Forest Preserve District of DuPage County point count data is also included in BCN eBird and this analysis. Their data are collected using similar protocols, but point counts last ten minutes. They collect data in two five minute intervals. For the sake of consistency, we used only the first five minute interval for our analysis.
DATA PREPARATION
Twenty-two years of data, from 1999 to 2020, was used in this analysis. Like earlier analyses of these data, it was found that the first years of the BCN Survey (1997 and 1998), where sample sizes were small, did not contribute meaningfully to trend estimates. After combining multiple survey databases, data were cleaned by removing: duplicates, data with inconsistencies, and those lacking repeat surveys within a given season. Data were filtered by date (June 1st - July 10th) and time of day (5:00 AM - 10:30 AM). The final dataset contained 29,724 surveys conducted at 2,463 points. We included the 113 bird species in the analysis that were detected at a minimum of 20 point-count locations across all years.
DATA ANALYSIS
The data were analyzed using N-mixture models. N-mixture models estimate true abundances of birds at each site by combining a model describing latent site-level abundance N with a model describing detectability where observed counts, Y, depend on N and detectability, p. These models require repeat visits to sites within seasons, but no additional data is needed to estimate N. Using generalized linear models, N is modeled as a log linear function of site-specific covariates (and, for trend models such as ours, a year covariate); p is modeled as a function of visit-specific covariates using a logit-link transformation.
We fit year-stratified N-mixture models (Kery and Royle 2020) using the R package Unmarked (Fiske and Chandler, 2011). We included landcover covariates to account for potential systematic changes across years in which habitat types were surveyed which - if not addressed - could confound trend estimates. We derived habitat covariates for sites by summarizing area coverage of landcover types in a 100-meter radius around survey points. We utilized National Landcover Database (NLCD) data to describe five landcover classes: grass (grass and pasture/hay), trees (deciduous forest, evergreen forest, mixed forest, and woody wetland), crops/shrub (crops, shrub, and barren), wetland (herbaceous wetland and open water), and developed - low (developed very low and developed low). We included these five covariates along with year to model variation in abundance. To model variation in detectability, we included survey date (both linear and quadratic forms) and survey time.
Because the effects of certain modeling choices were unclear, we conducted sensitivity analyses to decide which count distribution to use and whether to include an approximation of the area surveyed in models. We explored the sensitivity of trend estimates (means and standard errors) to using a negative binomial or Poisson distribution for abundance models and found differences to be small. Given AIC values were smaller for models using the negative binomial distribution, we utilized that distribution to model N. Additionally, while most data were collected using a 75-m detection radius, a subset of the data were collected using a 50-m radius, a 100-m radius, or at an unlimited distance. Therefore, in the abundance models, we explored including the area surveyed as an estimated covariate; as an offset term; as a binary factor to identify unlimited distance surveys; or none of the above (i.e., no area surveyed information). We found that when we included area as an estimated covariate, trend and trend standard error estimates were sometimes inflated. Estimates were reasonable in the offset and factor models, but produced trend estimates similar to models without the area surveyed information and with higher AIC values. Therefore, we did not include area surveyed information in our ultimate models.
CITATIONS
Fiske I, Chandler R (2011). “unmarked: An R Package for Fitting Hierarchical Models of Wildlife Occurrence and Abundance.” Journal of Statistical Software, 43(10), 1–23. https://www.jstatsoft.org/v43/i10/.
Kéry, Marc, and J. Andrew Royle. Applied Hierarchical Modeling in Ecology: Analysis of distribution, abundance and species richness in R and BUGS: Volume 2: Dynamic and Advanced Models. Academic Press, 2020.
DATABASE
Data collected following BCN's breeding bird point count protocol is submitted and stored in eBird.
eBird: An online database of bird distribution and abundance [web application]. eBird, Cornell Lab of Ornithology, Ithaca, New York. Available: https://www.ebird.org.
.

Copyright © Bird Conservation Network | Site by: EricSecker.com